

When you’re looking at slots, theoretical Return to Player – universally abbreviated as RTP – is probably the most cited metric, but relying on it as a solitary indicator of how a session will play out is a common mistake new players are almost bound to make. After all, there’s a reason why it’s provided alongside an entire table of other metrics for the game.
The best online casino sites will offer plenty of variety in terms of gameplay, which is why two titles can both sit at an identical RTP of 96.00% while still feeling like they belong to entirely different software genres. When you load up two games with matching math ratings side by side, the code processes that 96.00% benchmark over millions of simulated spins, so the actual delivery of those numbers across a play session comes down to structural variables that RTP isn’t enough on its own to show.
Think of it like this: bread and cake both (usually) contain flour, just like two slots have in common the same RTP. But, with lots of other factors at play (your sugar, your yeast, your vanilla extract) the end results of the two recipes are super different.
Variance Allocation and Hit Frequencies
You set a baseline wager on a classic 5×3 title and notice small line payouts triggering on every third or fourth turn. The hit frequency sits high (say, around 30%) meaning the math engine distributes its payout budget in small, regular drops across the main reels, keeping your balance line relatively flat.
Swap to a different title with the exact same 96.00% rating, and you might sit through twenty-five consecutive turns without seeing a single symbol combination land on the grid.
That second engine runs on a low hit frequency paired with a high variance allocation, hoarding the math budget for rare multi-tier scatter features, expanding wilds, progressive multipliers, and bonus triggers, which means that while both titles return the exact same mathematical percentage over millions of automated spins, your immediate session experiences couldn’t be more distinct.
Then again, hit frequency is only one part of the equation (again).
Base Game vs Bonus Feature Budgets
One developer might assign 75.00% of the return pool to standard base-game symbol matches, reserving just 21.00% for free spin rounds, while another studio reverses that formula, locking 60.00% of the total payout budget deep inside a multi-level bonus game that only triggers once every two hundred spins on average.
What you end up with is two very different pacing models, and what appeals to who is ultimately a question of player preference.
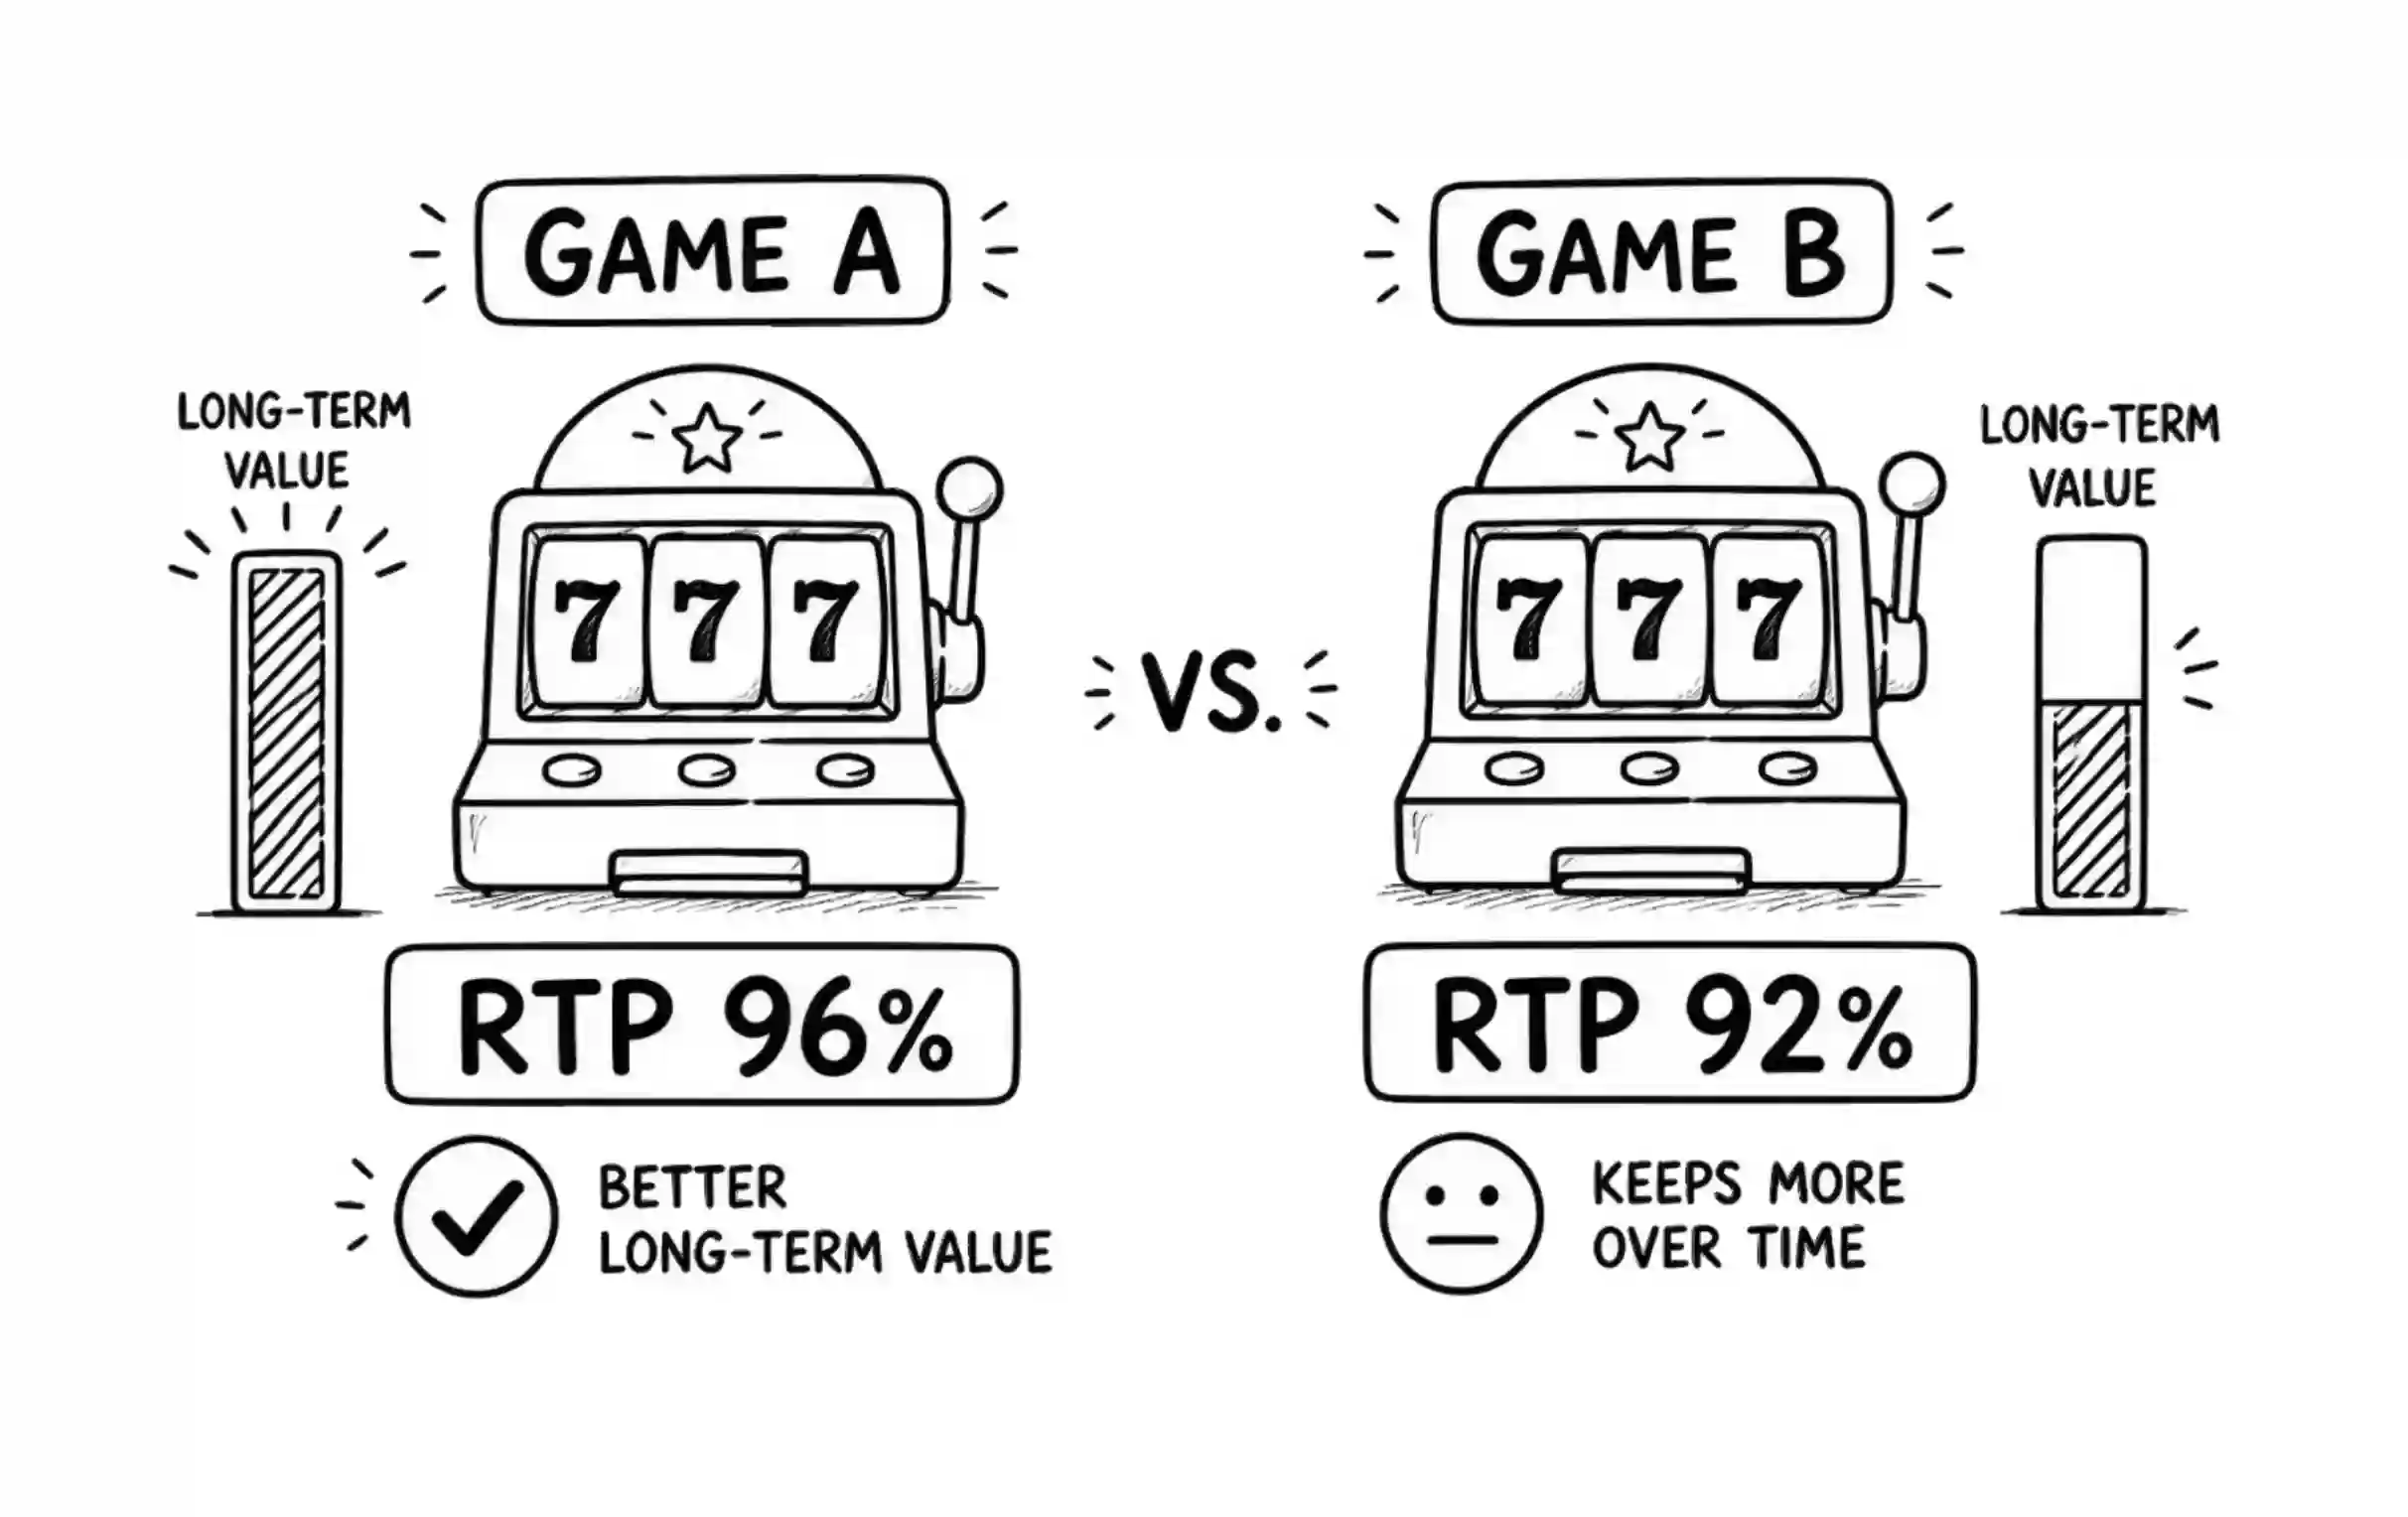 The first game feels responsive during regular play because standard four-of-a-kind symbol combinations yield meaningful multipliers right on the main grid. The second game feels quiet during standard spins, treating regular reel turns as a holding phase while the engine waits for three scatter symbols to drop into view and unlock the heavy feature weight.
Max Win Caps and Symbol Paytable Structures
The internal paytable hierarchy creates another massive divide in how identical RTP ratings process across a session. A game capped at a 1,000x maximum payout spreads its statistical weight broadly across medium-tier symbols, giving four-of-a-kind and five-of-a-kind matches decent values across active paylines.
A title with a 50,000x top multiplier cap has to starve its base paytable to account for that massive ceiling, meaning regular five-of-a-kind matches pay out tiny fractions of your stake while the math engine waits for a mathematical anomaly to align full screens of top-tier icons alongside maximum multipliers. If we think back to early digital slot designs where paytables were relatively uniform across different titles, modern math models allow developers to tweak symbol weightings, cap ceilings, cluster mechanics, and trigger frequencies in ways that make identical 96.00% ratings feel utterly unalike from the very first spin.







Comments are closed.